Overlay peptide IDs on 2D map
For this tutorial you will need a .pep.xml file and a corresponding mzML/mzXML file. The
.pep.xml file MUST contain retention time information (retention_time_sec attribute in
spectrum_query tags). You will likely have that if you used mzML/mzXML or native file formats
to perform the search (instead of something like an mgf file).
Importing .pep.xml file
In a Proteomics project right-click Identifications node and select Import.
Overlaying and viewing peptides as a table
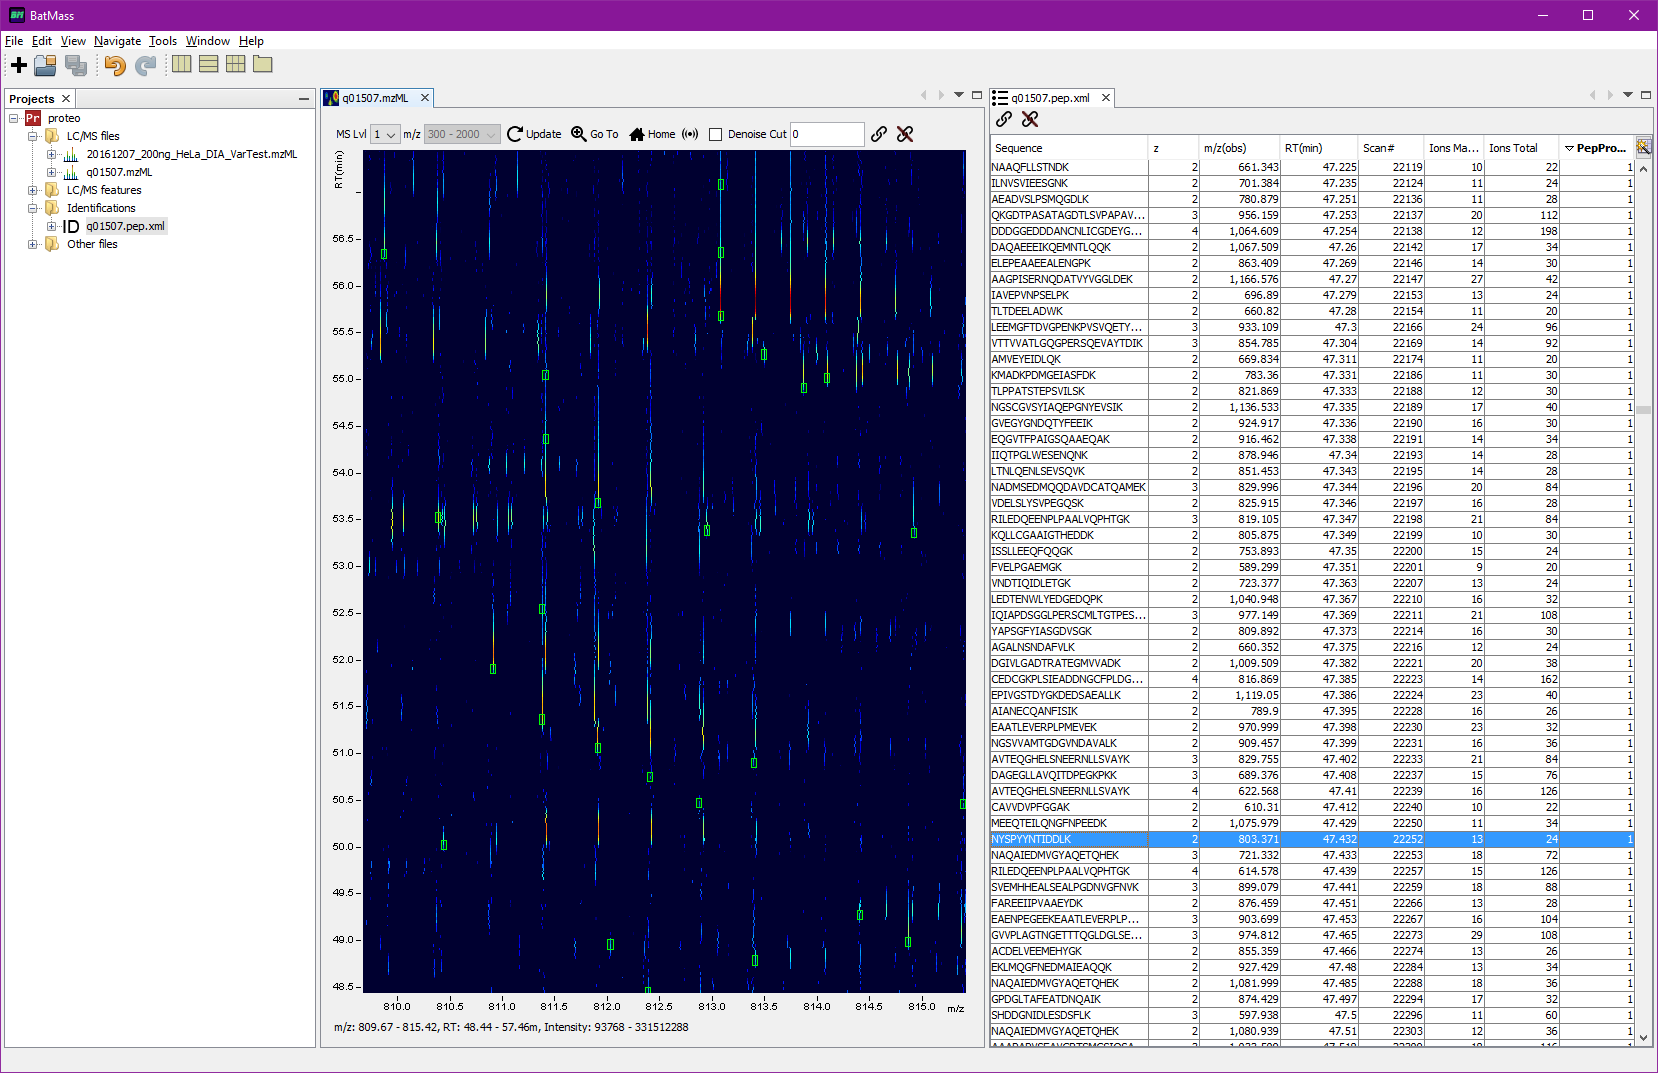
To display the tabular view right-click the imported file, select View -> Table. The table can be sorted by one or multiple columns. To sort by multiple columns hold Shift when clicking
on column headers.
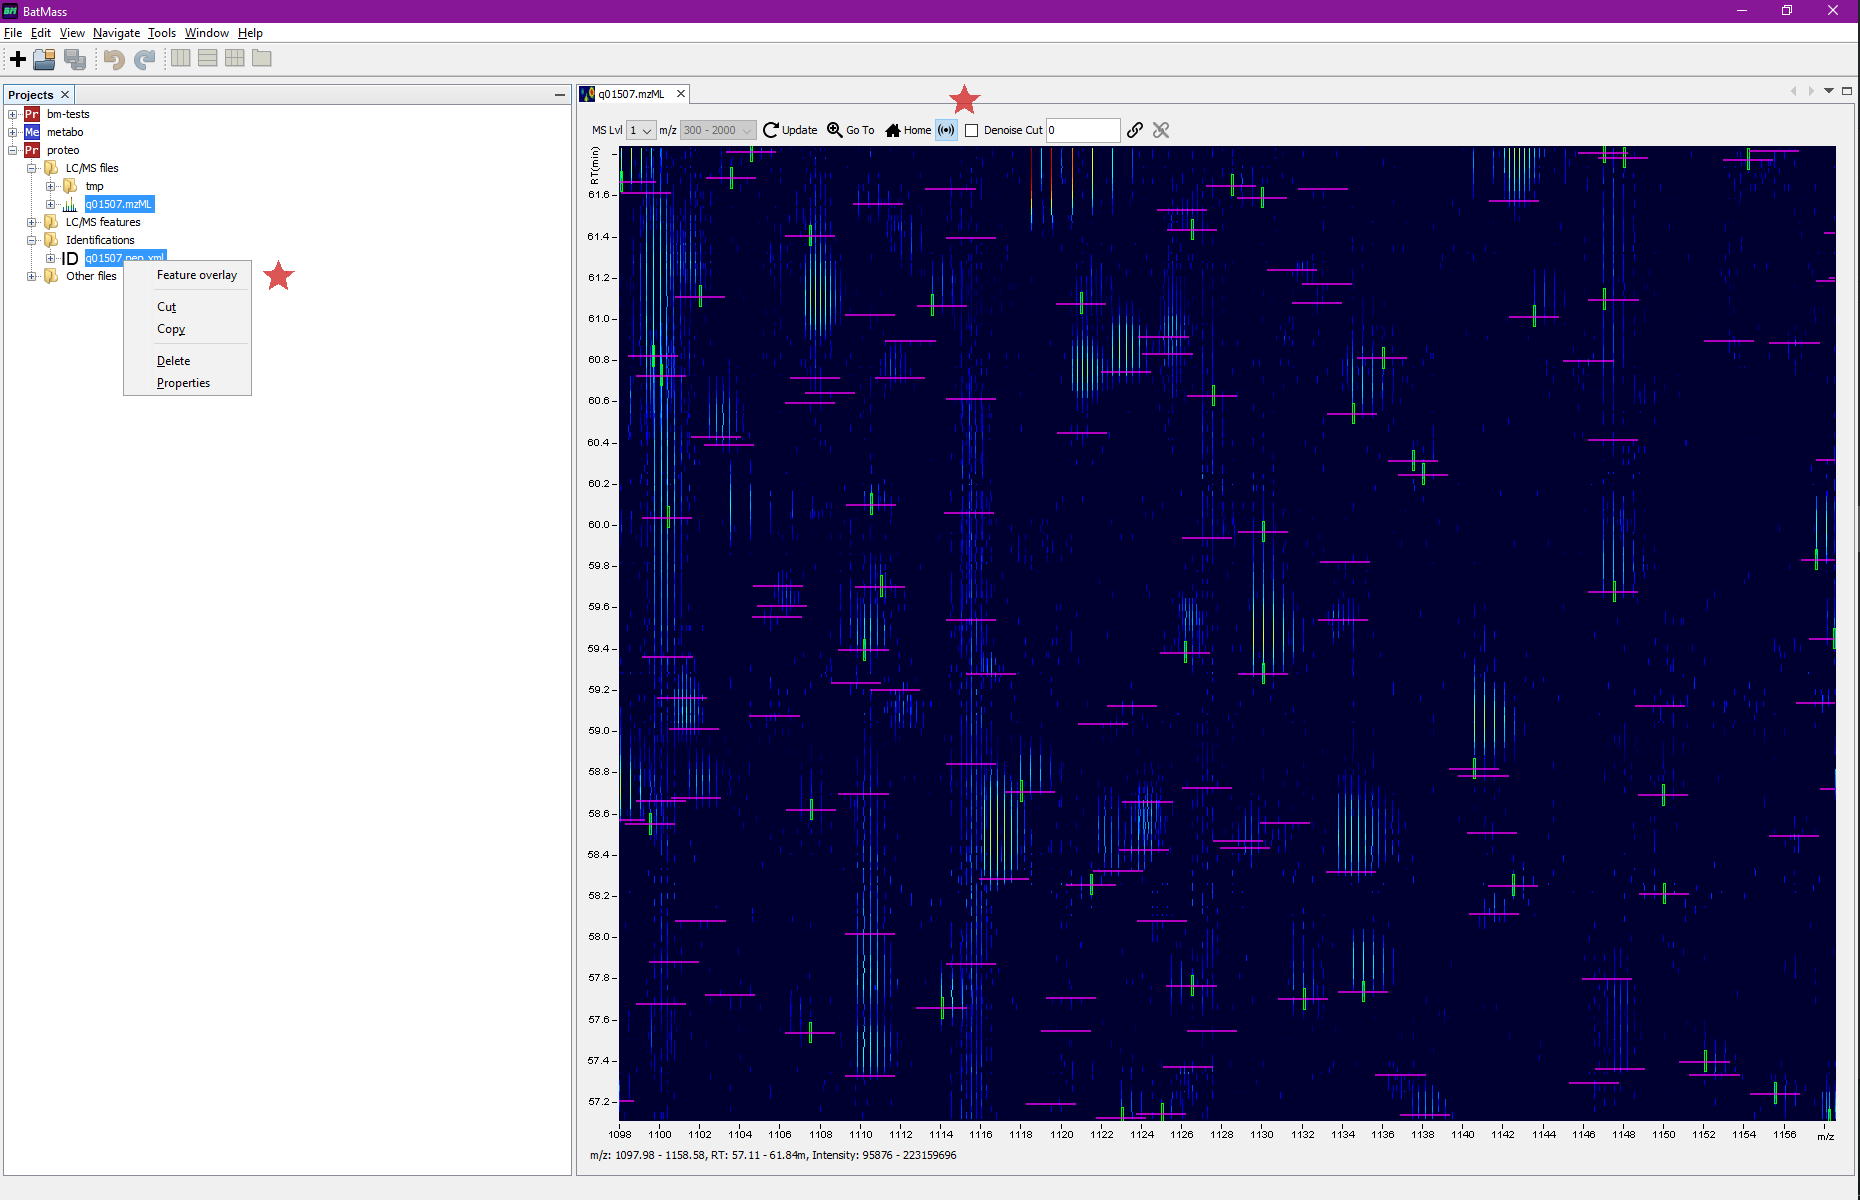
To overlay data on 2D map, select both files simultaneously (the .pep.xml file and the LC/MS file)
to overlay onto, right-click any of them, there should be an option to Overlay on 2D Map in the context menu.
You can now link the Map2D with Table viewer by dragging the link icon
![]() from the toolbar of Map2D to the link icon
from the toolbar of Map2D to the link icon
![]() in the Table view toolbar. Now double-clicking
on a row in the table will automatically zoom the Map2D to the corresponding region.
in the Table view toolbar. Now double-clicking
on a row in the table will automatically zoom the Map2D to the corresponding region.
If you also click the sonar-like button in the toolbar (see screenshot below) of 2D Map, you'll get all the MS2 events marked in magenta. For these boxes the width means the actual isolation window, if that information was available in mzML, otherwise it defaults to 1.5 Da. This way you'll readily see which MS2 even led to identifications – magenta box will be crossing the green box, see screenshots.
Example